In its simplest sense, inflation is an increase in the prices of goods and services. For instance, if the price of a certain good is $10 and in the next month the price increases to $12, the inflation on that item over one month is 20%. Many economists consider low levels of inflation sustained over time to be normal in a functioning economy. However, drastic price increases, or hyperinflation, can cause serious economic and social distress.
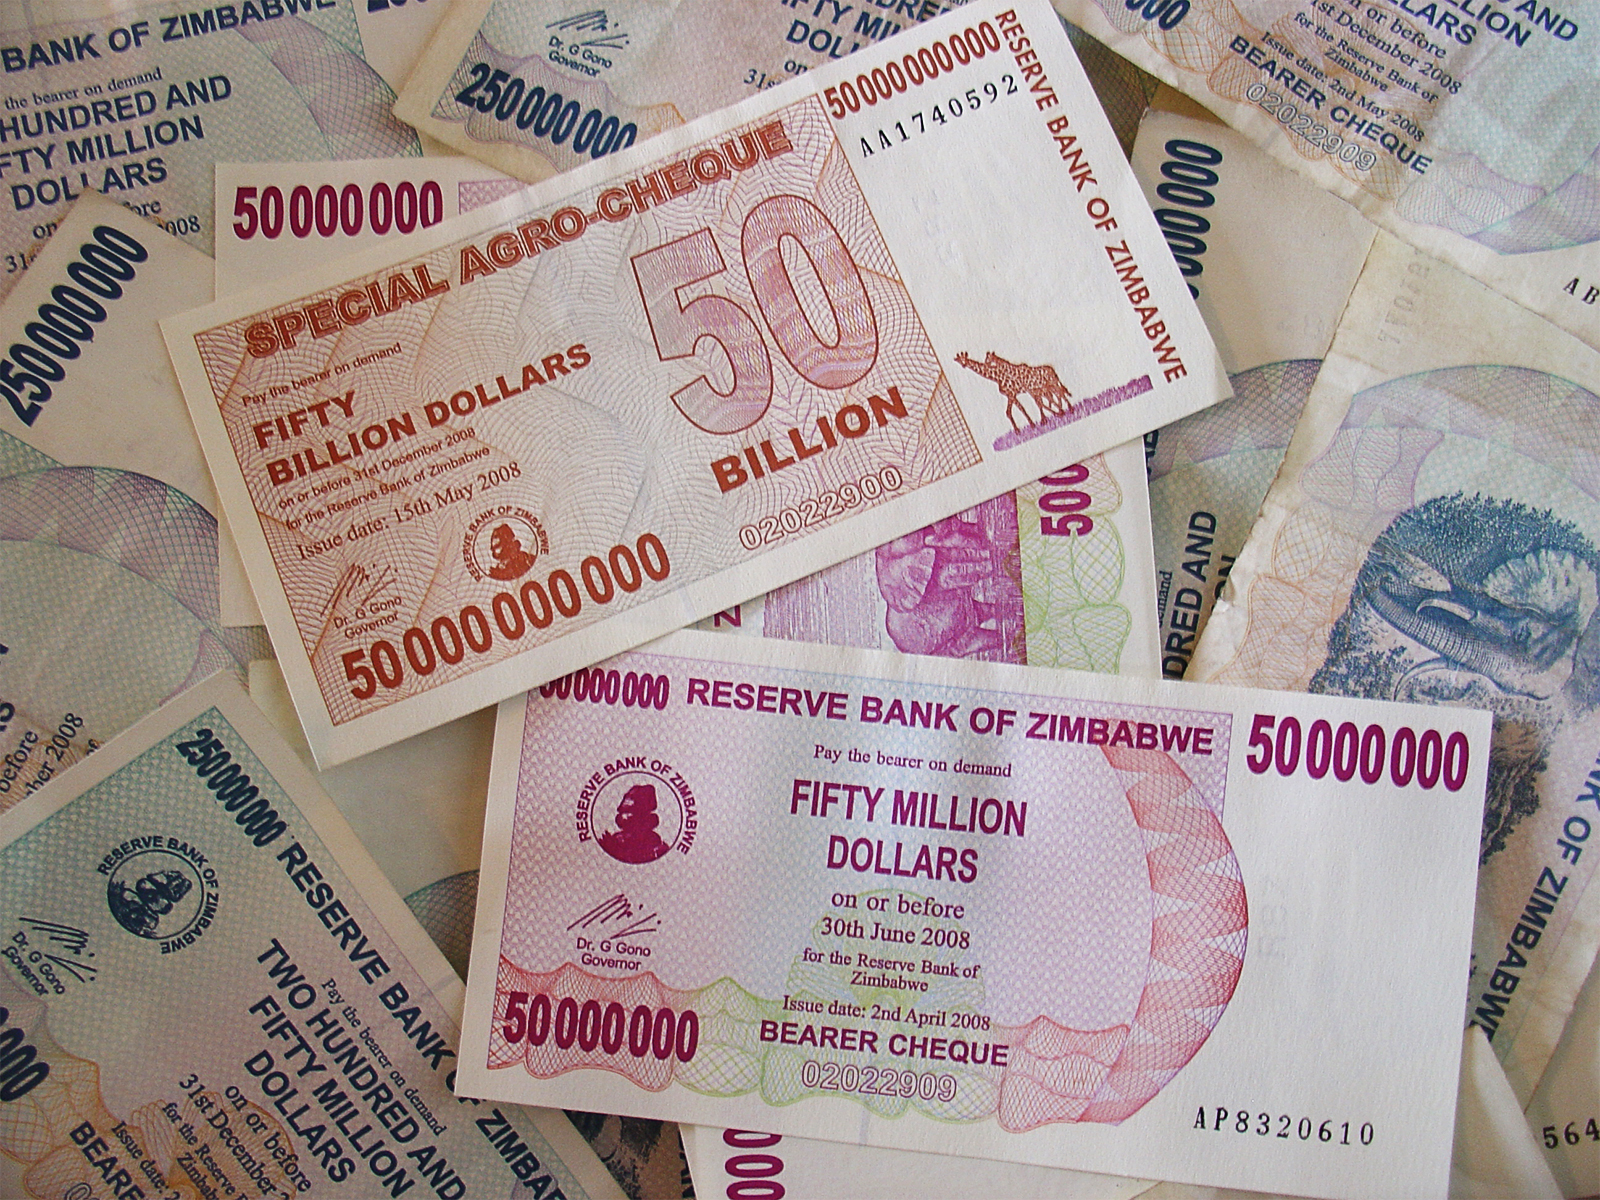
When Zimbabwe experienced hyperinflation in the 2000s, almost 80% of the population was unemployed. By 2005, the informal sector, which comprised only 10% of the economy in 1980, became the main source of income for the majority of Zimbabweans.

People gathering to buy a loaf of bread in Berlin, Germany, 1923 (Will Potter, Wikimedia Commons).
In the Weimar Republic in the early 1920s, a wheelbarrow full of money couldn’t buy a newspaper. There were food riots, pensioners were starving, and farms were looted in the countryside. The situation undermined citizens’ faith in the German democracy, leading to conspiracy theories. Because of episodes like this, governments around the world strive for a moderate rate of inflation.
The causes of inflation have long interested academics and researchers, who have developed various theories to explain the phenomenon. One of the most known is the money supply theory of inflation. Simply put, the theory is that inflation results from a rapid increase in the money supply that is not accompanied by an equally rapid increase in goods and services. As Milton Friedman famously pronounced, “Inflation is always and everywhere a monetary phenomenon.”
Friedman, as well as most economists today, advocated an ongoing, moderate increase in money supply. Though Friedman did not advocate inflation, many neoclassical economists promote an “optimal rate of inflation,” such as the 2% rate favored by the U.S. central bank, the Federal Reserve. They assume that constant growth in the availability of goods and services—which requires constant growth in “productive capacity”—will prevent hyperinflation. The problem is that, when mainstream economists think of productive capacity, they focus on labor and capital.
Contrarily, the trophic theory of money (TTOM), developed by Brian Czech, highlights the crucial role of land and natural resources in productive capacity. Pursuant to the TTOM, inflation occurs when the growth rate of nominal money outstrips the growth rate of real GDP. And today, land and natural resources—the factors of production ignored by neoclassical economists—constrain the growth of real GDP.
Money Supply and Inflation
For proponents of the money supply theory of inflation, the central bank is the institution that determines the money supply. The central bank provides money to commercial banks in the form of reserves. Commercial banks then loan the money to consumers and businesses.
If for any reason the central bank decides to increase the money supply, it decreases the interest rate it charges commercial banks. In turn, commercial banks lower interest rates on loans, thereby encouraging businesses and consumers to borrow more, functionally creating money. The increased borrowing leads to an increase in consumption and investment, respectively. In this scenario, if productive capacity (for mainstream economists, that’s labor and capital only) is constant or doesn’t grow as quickly as the money supply, there will be a growing money supply chasing the same amount of goods and services. This could lead to very high inflation.
The inflationary episodes in the Weimar Republic and Zimbabwe provide some empirical support for this model of inflation. The central banks in both countries printed huge sums of money, resulting in inflation rates above 100 percent. In response to these events, central banks throughout the world are generally careful with their management of the money supply.

Various currency notes in Zimbabwe during the period of hyperinflation (Wikimedia Commons).
Mainstream economists also frown upon the financing of governments by their central banks, known as monetary financing. Commentators criticized U.S. spending on the COVID-19 crisis for this very reason. They argued that the spending, because it was financed by the Federal Reserve, would drive inflation.
The Trophic Theory of Money and Inflation
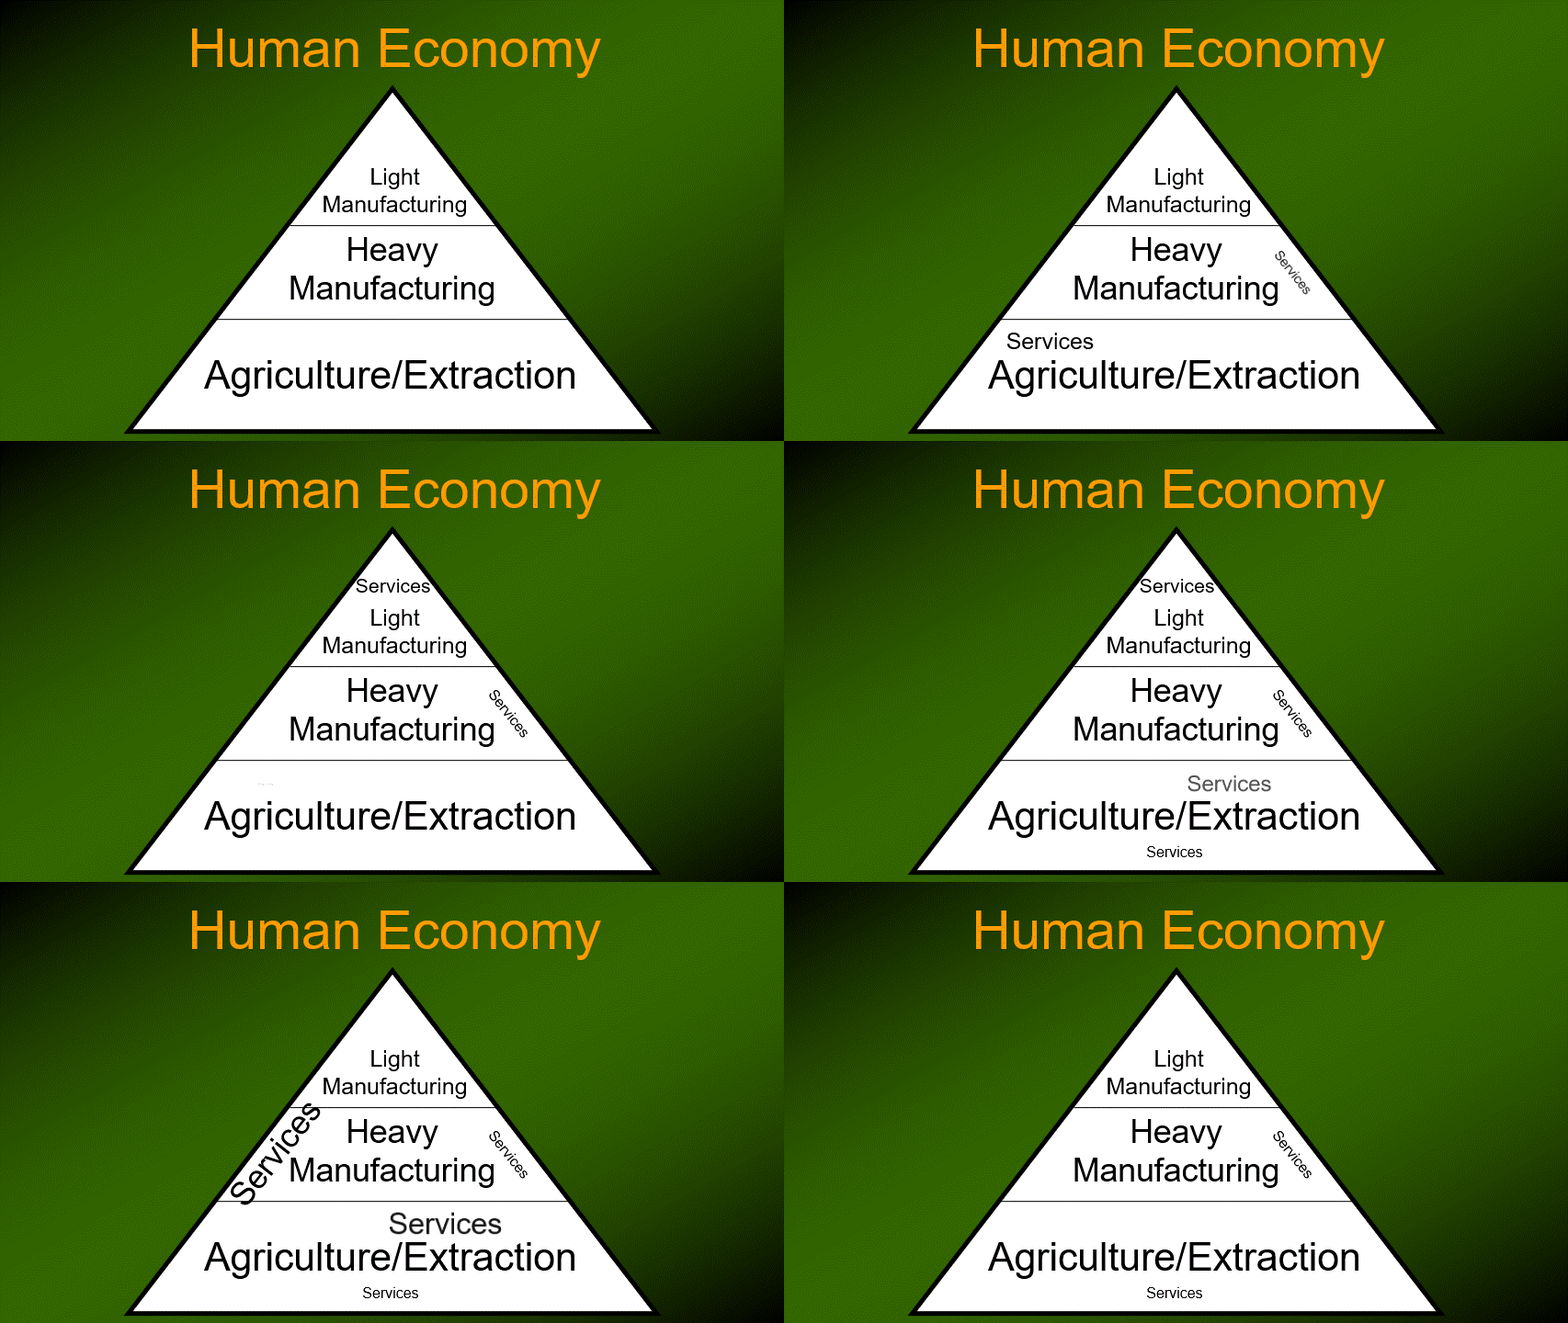
The TTOM starts several steps before the printing of money by the central bank. It is based on the “trophic structure of the economy,” which reflects the “economy of nature.”
In nature, nutrients and energy flow from plants to primary consumers and then to higher consumers. Primary consumers directly consume plants, whereas secondary consumers consume the primary consumers. In this trophic structure of nature, the plants are the base. If plants didn’t produce nutrients, no nutrients would be available for primary and higher consumers, and the trophic structure would collapse.

The trophic structure of the human economy.
The human economy has the same trophic structure. The agricultural and extractive sectors compose the base of the economy, from which materials and energy flow to heavy manufacturing and subsequently to light manufacturing. This “triangular economy,” then, depends on the agricultural and extractive sectors. If these sectors collapsed, materials and energy would stop flowing to the manufacturing (and service) sectors. The whole economy would collapse.
From this ecological understanding of the economy, the trophic theory of money is derived. Pursuant to the TTOM, agricultural surplus “frees the hands” for the division of labor in the manufacturing sectors. The division of labor allows for the production of a variety of goods and services (or “gervices,” as Czech described them recently). People then use money to exchange these goods and services.
Therefore, to put it simply, money originates from agricultural surplus. If there were no agricultural surplus, there would be no division of labor, no exchange of goods and services, and no need for money. Money is therefore warranted by agricultural surplus, and the amount of money stemming from that surplus is termed the “warranted money supply.” The TTOM implies that the money supply managed by the central bank—“nominal money”—should be created only as money is warranted by agricultural surplus. A solid monetary structure is therefore dependent on agricultural surplus.
Following this line of logic, inflation originates in the distinction between nominal and warranted money supplies. If the nominal money supply outstrips the growth in the real economy, the excess money supply will cause inflation. On the flip side, if the real GDP, backed up by agricultural surplus and other natural resources, keeps up with the nominal money supply, the latter can grow without leading to inflation.
The TTOM adds value to conventional economists’ understanding of the relationship between money supply and inflation by demonstrating the importance of land (agricultural surplus) in productive capacity. Labor and capital are part of productive capacity, but they also depend on agriculture and other natural resources. As our economy barrels past planetary boundaries, natural resources become a more significant determinant of productive capacity relative to labor and capital.
The Case of the United States
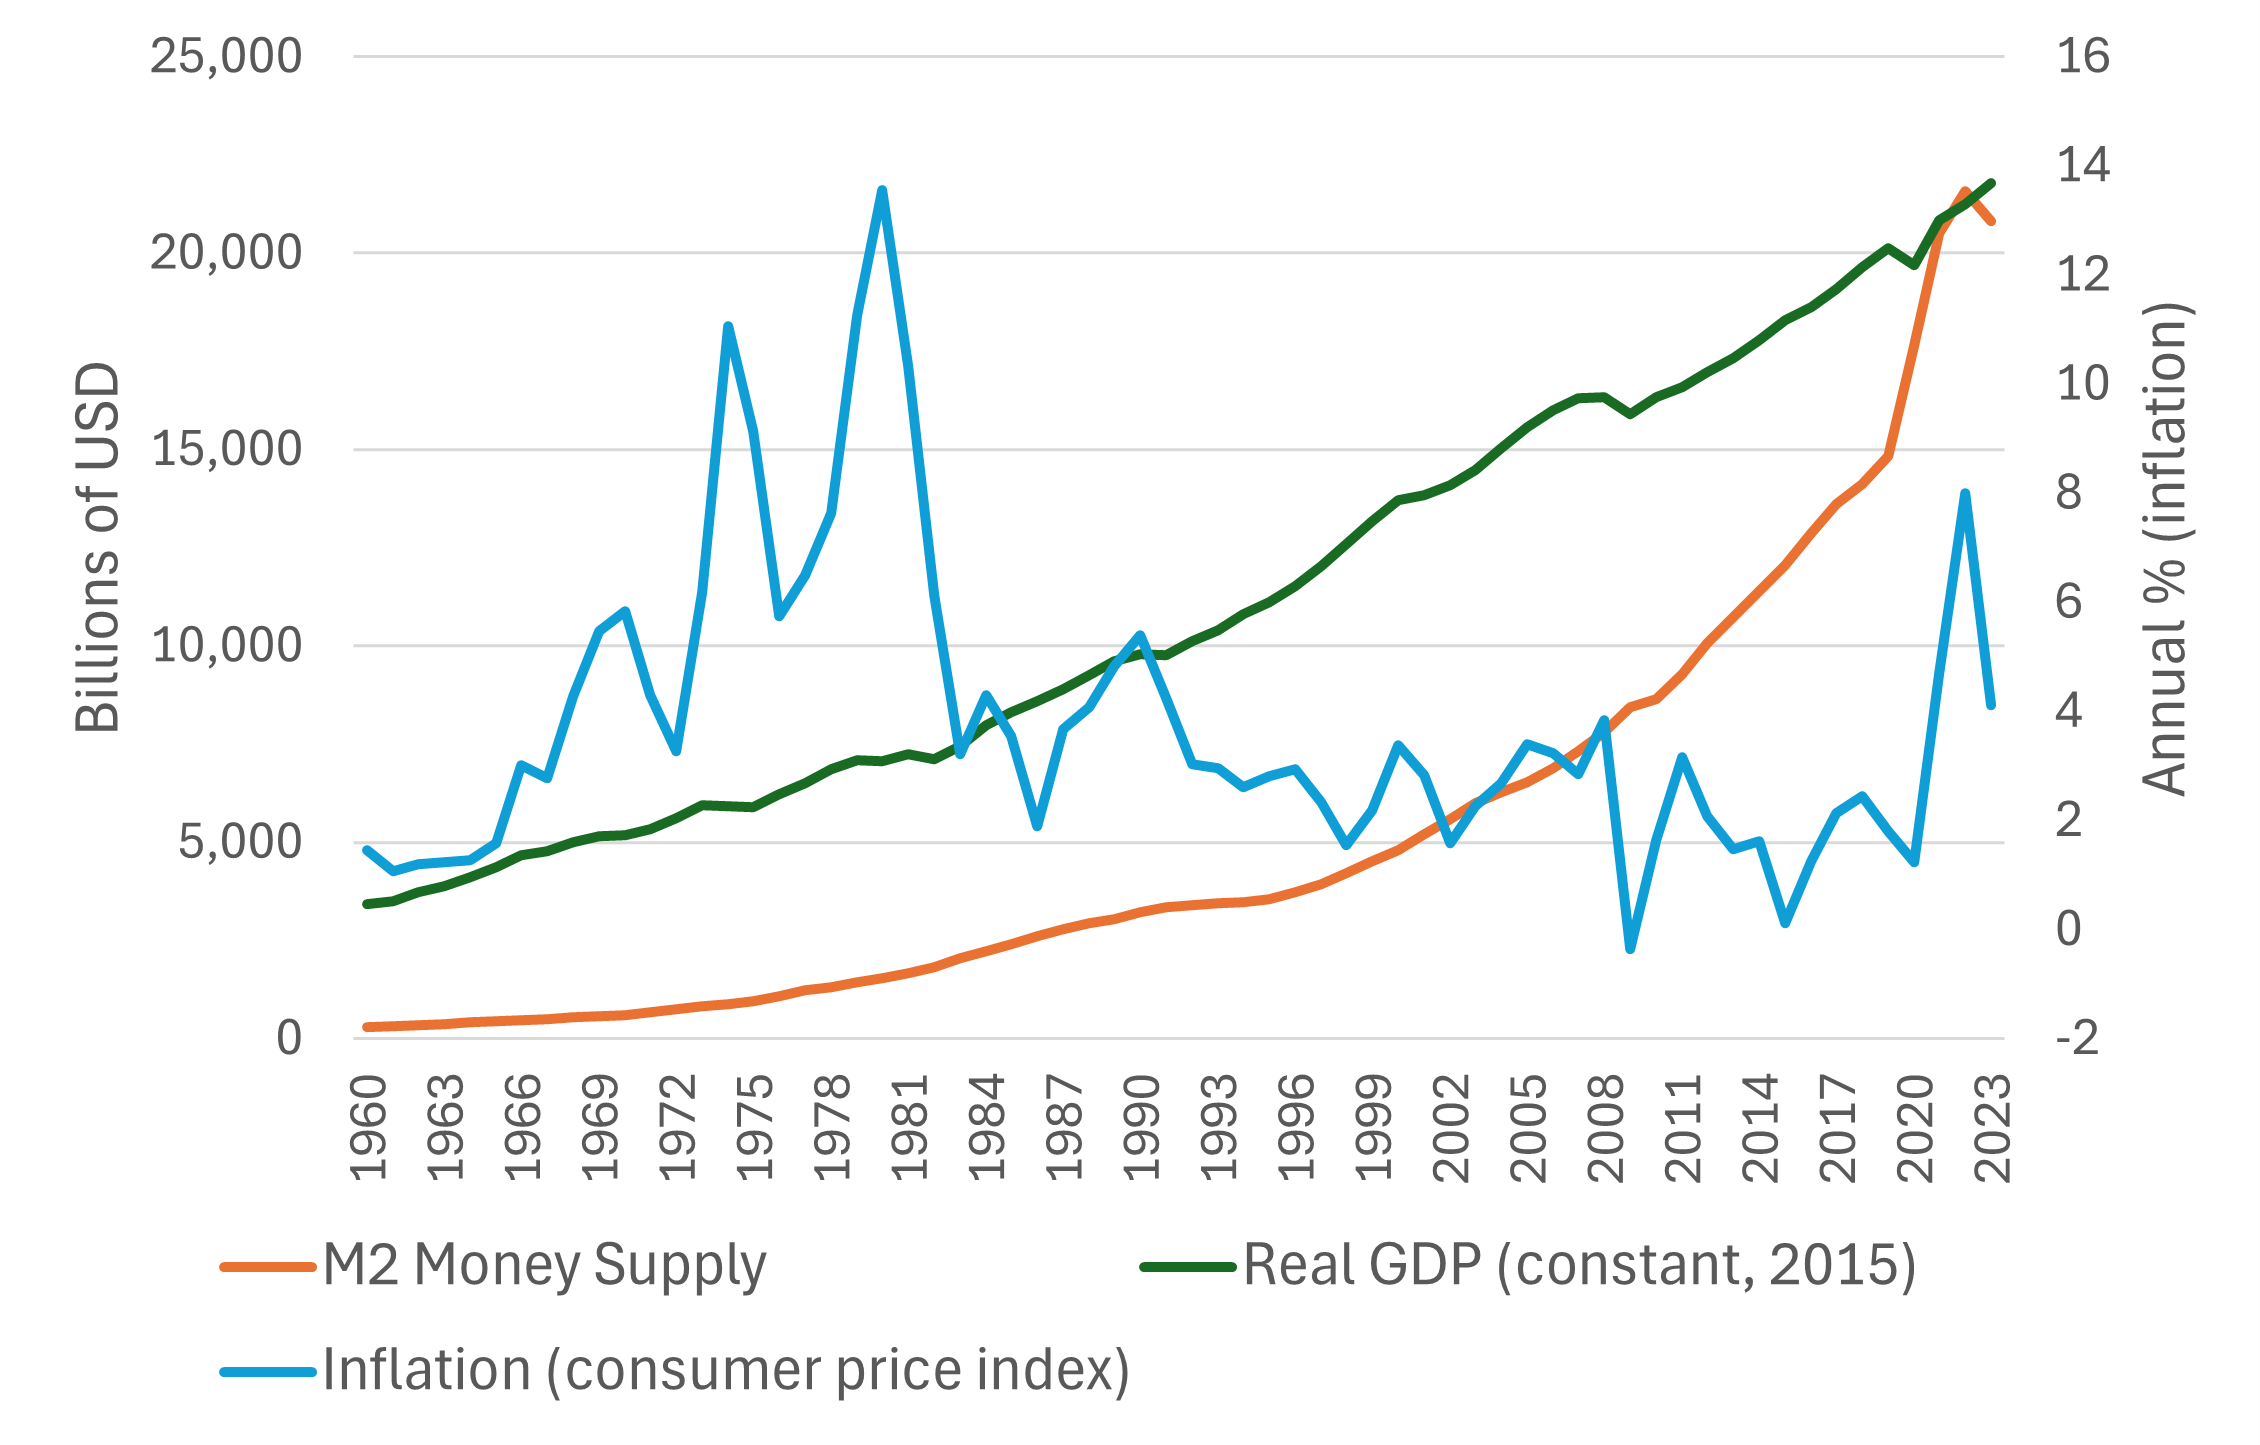
How have money supply, real GDP, and inflation behaved over the last half-century? Global trends tell us more about natural resource scarcity than do domestic trends, which are obscured by trade. However, global data on money supply is incomplete and inconsistent, so let’s consider U.S. trends, in particular: 1) “M2,” a commonly used metric that includes central bank reserves, currency in circulation, and deposits held at commercial banks; 2) real GDP, adjusted for inflation using 2015 price levels; and 3) the Consumer Price Index (CPI).

U.S. money supply, real GDP, and inflation from 1960 to 2023 (author’s graph, data from the Federal Reserve Bank of St. Louis and the World Bank).
We can’t determine by simply looking at a line graph how these variables affect one another, as there are a multitude of confounding factors. However, we can speculate on some particularly relevant phenomena. First, money supply was between $3 and $9 trillion lower than real GDP until 2020. This gap is largely due to the nature of the two metrics: money supply is the amount of money in circulation at a point in time, and real GDP captures the value of finalized goods and services produced within a time period. A dollar only counted once in money supply is counted multiple times in annual GDP if used for multiple goods and services throughout the year.
Second, the money supply curve became untethered from the real GDP curve in the last few years, surpassing it in 2021. This means the velocity of money dipped below one. In other words, the average dollar in the economy changed hands less than once throughout the year. The drastic increase in money supply was thanks to unprecedented quantitative easing (money creation) employed by the Federal Reserve in response to the pandemic.
The money supply increase was followed by an inflation spike. The economy didn’t have the productive capacity to absorb the almost $6 trillion injected into it over two years. However, the real GDP bounce-back in 2021 and the decrease in inflation in 2023 suggest this lag in productive capacity was temporary. It was due more to supply-chain disruptions and other economic impacts of the pandemic than to natural resource depletion. Unless we change course, the latter will have a long-term impact on U.S. productive capacity as we draw down nonrenewable resources and outstrip Earth’s capacity to regenerate renewable ones. This is already playing out at the global scale.
Third, 1969 to 1982 were marked by some of the highest rates of inflation in U.S. history. Though it’s difficult to perceive on the graph, due to scale, this period was accompanied by high money supply growth and low GDP growth relative to the 1961 – 69 and 1982 – 2007 periods. Rare occurrences of money supply growth over ten percent in 1971 – 72 and 1975 – 77; and real GDP declines in 1974 – 75, 1980, and 1982; are particularly notable. The high inflation of the ‘70s and early ‘80s is widely considered to have been connected to oil supply shocks.
Fourth, for the first time in 75 years, U.S. M2 decreased from 2021 to 2023. To curb inflation, the Federal Reserve practiced quantitative “tightening,” which it had only used once before (2017 – 2019). The consequences of this policy aren’t well understood, but inflation has indeed decreased.
What does all of this say about the money supply theory of inflation and the TTOM? For starters, the simplistic view held by many laypeople that “printing money” always leads to inflation is faulty. Money supply increases are only inflationary if the economy doesn’t have the productive capacity to increase supply accordingly. Though economists have historically considered productive capacity in terms of labor and capital, the importance of natural resources is demonstrated by the devastating effects of supply chain disruptions in the ‘70s and early 2020s. In those cases, the disruptions were caused by political instability and by a pandemic. What happens when they’re caused by scarcity?
Perhaps a sense of impending economic doom has fueled Americans’ recent dissatisfaction with the economy, despite economists’ rosy assessments. Inflation was one of the major issues ahead of the 2024 presidential election, in a way that we had not seen since the 1980 presidential election, in response to the oil shock. Yet the president-elect’s plans to combat inflation will have questionable short-term outcomes and likely devastating long-term impacts.
Just because we have the productive capacity for growth doesn’t mean we should use it. We can choose to stop the economic growth machine and keep it idling in a steady state, preserving the little environmental integrity that remains, before the machine is forced to a halt. This will require thinking outside the box and using monetary policy tools unconventionally.


