Ed. note: Part 1 of this series can be found on Resilience.org here.
Oil Production in Middle East OPEC Nations
Middle East Oil Production
The Middle East is well known as a prominent oil producing region. It has many of the largest convention oil fields in the world such as Ghawar (Saudi Arabia Estimated Ultimate Recovery (EUR) 110-120 Gb), Burgan (Kuwait EUR 66-72 Gb), Safaniya (Saudi Arabia EUR 37 Gb), Rumaila (Iraq EUR 20 Gb), Ahvaz (Iran EUR 25 Gb), and many more.
Five countries in the Middle East are members of the Organization of Petroleum Exporting Countries (OPEC): Saudi Arabia, Kuwait, Iran, Iraq and the United Arab Emirates (UAE). Middle East oil producers tend to be quite secretive when it comes to field level information. The U.S. Department of Energy/ Energy Information Administration (U.S. DOE/EIA) provides oil production data for OPEC countries, but with few exceptions, the status of various fields is not so clear.
Figure 1 is a map showing where Middle East oil and gas fields are located:

Figure 1*-Middle East oil and gas fields (oil fields are green, gas fields are red)
*From the Internet
At this point in time, the Middle East has been pretty thoroughly explored for oil fields so the major fields, and most minor fields, have been found. Note that the big green blob in Saudi Arabia is the Ghawar field, the largest conventional oil field in the world.
Figure 2 is a graph of the summed oil production for the five Middle East OPEC countries from 1973 through the first quarter of 2022 (Graphs in this report are personally prepared graphs from U.S. DOE/EIA data unless otherwise specified):
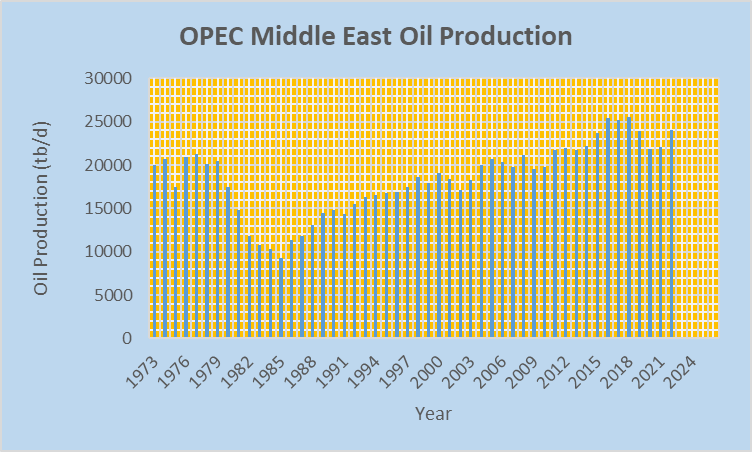
Figure 2-Middle East OPEC oil production
The summed production rate for the five countries in 2018 was 25.51 mb/d or 9.31 Gb/year, not an insignificant amount.
What is noteworthy about the Middle East OPEC countries when it comes to recent oil production is that the Iraqi oil production rate in 2019 approached 5 mb/d (4.72 mb/d), the UAE oil production rate has risen pretty steadily since 1990 to almost 3.5 mb/d (3.49 mb/d) in 2019, Iran’s oil production rate was up to nearly 4.5 mb/d (4.45 mb/d) in 2017 and Kuwait approached 3 mb/d (2.98 mb/d) in 2016. The point here is that these production rates are high for a relatively small geographical area.
OPEC is notorious for exaggerating reported oil reserves. Many years ago Middle East OPEC countries adjusted their reported oil reserves up and since then those values have largely remained flat as Figure 3 illustrates:
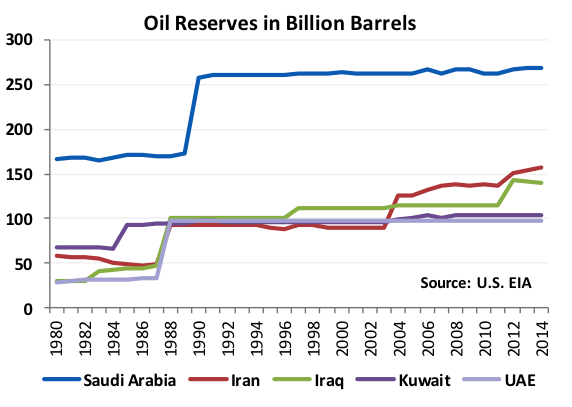
Figure 3*-Middle East OPEC reported oil reserves
*From the Internet
In the case of Saudi Arabia, they adjusted their reported reserves up to around 260 Gb in approximately 1990 and the reserves have since been adjusted up a bit to 268 Gb. From 1990 through 2021 Saudi Arabia produced 104 billion barrels of oil. That would suggest, assuming the original 260 Gb value is valid and no oil discoveries were made during 1990-2021, that remaining oil reserves at the end of 2021 should be 260 – 104 = 156 Gb. But reported reserves didn’t decline.
How valid is the original figure of 260 Gb for Saudi Arabia? That figure could be considerably exaggerated. We have to take the word of the Saudi government on that.
In 1996, PetroConsultants, Inc. provided the following most probable reserves for Middle East OPEC countries:
PetroConsultants, Inc. Estimates of Oil Reserves for Middle East OPEC Countries in 1996

Table I
I trust the data from PetroConsultants, Inc. (later becoming the IHS Group) more than I do the data from the governments of Middle East OPEC countries. Based upon the data in Table I and oil production for the period 1997-2021, that would put the remaining reserves at the end of 2021 as the values in Table II assuming no oil discoveries were made during the period:
Remaining Oil Reserves Based upon PetroConsultants, Inc. Estimates and Oil Production since 1996

Table II
The sum of oil reserves in Table II is 284.4 Gb. That is still a lot of oil but far less than the summed value based upon what Middle East OPEC countries have been claiming.
I view reported oil reserves originating from Middle East OPEC countries to be worthless. The problem is that the Middle East OPEC governments have a vested interest in what they report for reserves. Their production quotas are based upon reported reserves. Some countries, such as the U.S., under report reserves. In the case of the U.S., they under report reserves due to Securities and Exchange Commission (SEC) rules.
Unfortunately there is no independent organization assessing oil reserves for countries, no regular assessment of reserves and no internationally agreed upon standards for reporting reserves so reported reserves should be looked at with considerable skepticism.
Saudi Arabia-Where Oil is King
The largest Middle East oil producer by far is Saudi Arabia. Saudi Arabia has supposedly acted as the global swing oil producer for a long time and is still considered the swing producer. A swing producer is a producer that can raise and lower its oil production rate to accommodate changing oil market conditions.
Whenever the price of oil gets fairly high, such as now, the U.S. government applies pressure on Saudi Arabia to increase its oil production and Saudi Arabia generally does little or nothing to increase production beyond their general production rate of ~10-10.6 mb/d. In the case of the recent global oil demand situation when demand was low (2020-2021), they did lower production. In 2022 they have brought production back to their general production rate range.
I would argue that Saudi Arabia does little or nothing to go beyond their general production rate range because it can do little or nothing to increase production for a sustained period of time. Its major fields such as Ghawar, Safaniya, Abqaiq, Berri and Shaybah have been producing oil for decades and deletion is a serious problem in their old fields. Saudi Arabia is having enough problems just maintaining their general production rate let alone increasing the production rate.
Figure 4 is a graph of Ghawar oil field production:
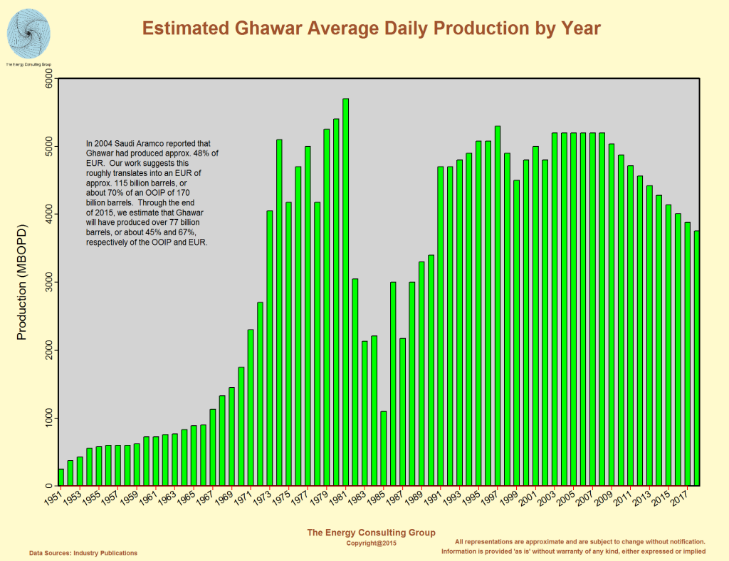
Figure 4*-Ghawar oil field production
*From the Internet
According to the graph, by 2018 Ghawar’s oil production rate had declined about 25% from the 2008 rate and the rate was declining every year. The following article makes the case that at best Ghawar can now produce only about 3.8 mb/d, much less that the 5.0 mb/d that was thought to be the case by outside observers:
Over the years, Ghawar has produced more than half of Saudi Arabia’s total oil production. As Ghawar’s oil production rate declines, it makes it harder and harder for Saudi Arabia to maintain its overall production rate.
Figure 5 is a graph of Saudi Arabia’s oil production rate from 1973 through the first quarter of 2022:
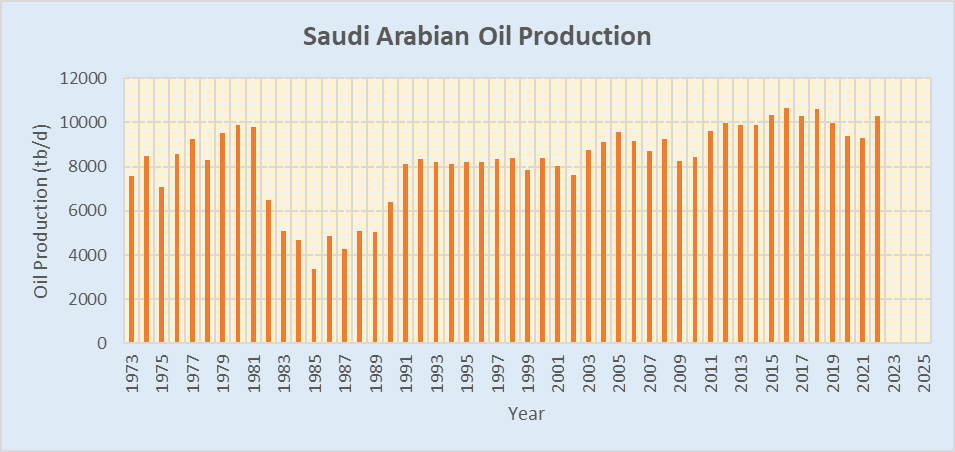
Figure 5-Saudi Arabian oil production
One point to note is that Saudi Arabia has never had an annual oil production rate above 11.0 mb/d. On an annual basis, Saudi Arabia reached its higher oil production rate in 2016 at 10.635 mb/d. With the price of oil being up in 2022, production has increased over 2021 to a rate of 10.288 mb/d in the first quarter (the 2021 production rate was 9.313 mb/d).
The vast majority of Saudi Arabia’s oil production comes from a small number of fields listed in Table III:

Table III
It’s worth pointing out that all of the fields in Table III were found before 1970. You will see that to be the case for other Middle East OPEC countries except for four fields in Iraq. The Middle East had been largely explored by 1970.
Table IV contains the best estimates I can find of present production rates for the fields listed in Table III:

Table IV
The summed production from the fields in Table IV adds up to 8.4 mb/d. The Saudi Arabian oil production rate in 2021 was 9.313 mb/d, meaning that the fields listed in Table IV could have produced roughly 90% of the country’s oil last year. Considering that Ghawar, Safaniya, Berri and Abqaiq appear to be in serious decline that is not a good sign for Saudi Arabia’s future oil production.
Based upon the graph in Figure 4, which estimates that as of the end of 2015 Ghawar had produced at least 77 Gb of oil and assuming an average production rate for Ghawar of 3.8 mb/d from 2016 through 2021, that would put the cumulative production of Ghawar at the end of 2021 at roughly 85 Gb. The EUR of Ghawar is 110-120 Gb. Ghawar can’t maintain a production rate of 3.8 mb/d for long with only approximately 25-35 Gb of oil remaining in the field. If Ghawar hasn’t already declined from the 3.8 mb/d rate I suspect it won’t be long before it does.
Safaniya oil production started in 1957. According to reports, it was producing 1.5 mb/d back in the 1980s but is producing only 0.6 mb/d today. I don’t have a graph of historical oil production for the field but having produced oil for so long and with a production rate as high as 1.5 mb/d, it would not be surprising that well over half of the EUR has been produced. The production capacity for the field is given as 1.3 mb/d. If the field is only producing ~0.6 mb/d that suggests the field is serious depleted.
The Abqaiq field was discovered in 1940. In 1973, it produced 1.09 mb/d. The estimated production rate now is ~0.4 mb/d, suggesting a serious depletion issue.
The Berri field reached a maximum production rate in 1976 of ~0.77 mb/d. In 2020, the production rate was approximately 0.3 mb/d. With an expansion of the field, commissioned for 2023-2025, it is claimed that production will be raised to 0.5-0.6 mb/d.
The Khurais field had a relatively low oil production rate until its expansion in 2009. According to Matt Simmons, Khurais was producing 144,000 b/d in 1981. With the recent expansion, the production capacity is listed at 1.5 mb/d.
International petroleum geologist Colin Campbell puts the EUR for Saudi Arabia at 300 Gb. Cumulative production for Saudi Arabia at the end of 2021 was 161.3 Gb, or 53.8% of 300 Gb.
The Other Middle East OPEC Nations
The remaining four Middle East OPEC countries, which I will refer to as the Middle East OPEC 4, have been producing oil at an impressive rate in recent years. In 2019, prior to the pandemic, their summed production rate was 13.96 mb/d and in 2021 it was 12.81 mb/d. That means yearly oil production is roughly 4.5-5 Gb.
Table V contains EUR values for the Middle East OPEC 4 from Colin Campbell, cumulative production data at the end of 2021 and % produced values at the end of 2021 based upon Colin Campbell’s EUR values:

Table V
It’s noteworthy that 3 of the 4 Middle East OPEC 4 have a percent of EUR produced value at the end of 2021 greater than 50% based upon Colin Campbell’s EUR values. That suggests that Iran, Kuwait and the UAE will not be able to significantly increase their oil production rates in the future beyond raising their values back to the values of approximately 2018 or 2019.
It should be pointed out that Colin Campbell has higher EUR values than are suggested by the PetroConsultants, Inc. data in Table II.
Figure 6 is a graph of Middle East OPEC 4 oil production from 1973 through the first quarter of 2022:

Figure 6-Middle East OPEC 4 oil production
There have been several significant ups and downs for Middle East OPEC 4 oil production due to wars and sanctions involving Iraq and Iran, most notably in the early 1980s, around 1990 and early 2000s. Oil production for Iran and Iraq has been pretty stable in recent years. I attribute the decline in production for 2020/2021 to the pandemic and reduced global demand for oil.
In the first quarter of 2022, the Middle East OPEC 4 had a production rate of 13.765 mb/d. The highest production rate for the Middle East OPEC 4 was in 2017 at 14.916 mb/d.
What’s happening within each individual Middle East OPEC 4 country? Like Saudi Arabia, much of the oil production within these countries comes from a small number of elephant fields so what happens within those elephant fields will determine future oil production for those countries.
Kuwait-Most of Kuwait’s oil is found in the Greater Burgan fields with a EUR of approximately 70 Gb. Considering that Kuwait’s EUR, according to Colin Campbell, is 90 Gb, that means the Greater Burgan fields represent nearly 80% of Kuwait’s total oil so what happens there strongly influences Kuwait’s total oil production and will in the future.
The Greater Burgan fields consists of 3 fields: Burgan and the much smaller Magwa and Ahmadi fields. The Burgan field was discovered in 1938. Cumulative oil production for the Greater Burgan fields, as of the end of 1996, was estimated at 28 Gb. Estimates put the production rate in recent years at around 1.5 mb/d. Assuming that rate has been used on average since 1996, that would put cumulative production at approximately 42 Gb at the end of 2021, ~60% of the EUR. That still leaves quite a bit of oil, roughly 30 Gb. Also, roughly 2 Gb of oil was burned off from the Greater Burgan fields in the Persian Gulf War of 1990-1991.
Beyond the Greater Burgan fields, Kuwait has 3 other fields in the 2-6 Gb range, shown in Table VI:

Table VI
The three fields in Table VI have been producing oil for a long time and are probably in a serious state of depletion.
Figure 7 is a graph of Kuwaiti oil production from 1973 through the first quarter of 2022:

Figure 7-Kuwaiti oil production
It will be interesting to see by how much oil production in Kuwait can increase over the production rates of the last few years. Note that the highest production rate in recent years for Kuwait was achieved in 2016 at 2.979 mb/d. In the first quarter of 2022, Kuwait’s oil production rate was 2.726 mb/d.
Iran– Figure 8 is a graph of Iranian oil production from 1973 through the first quarter of 2022:
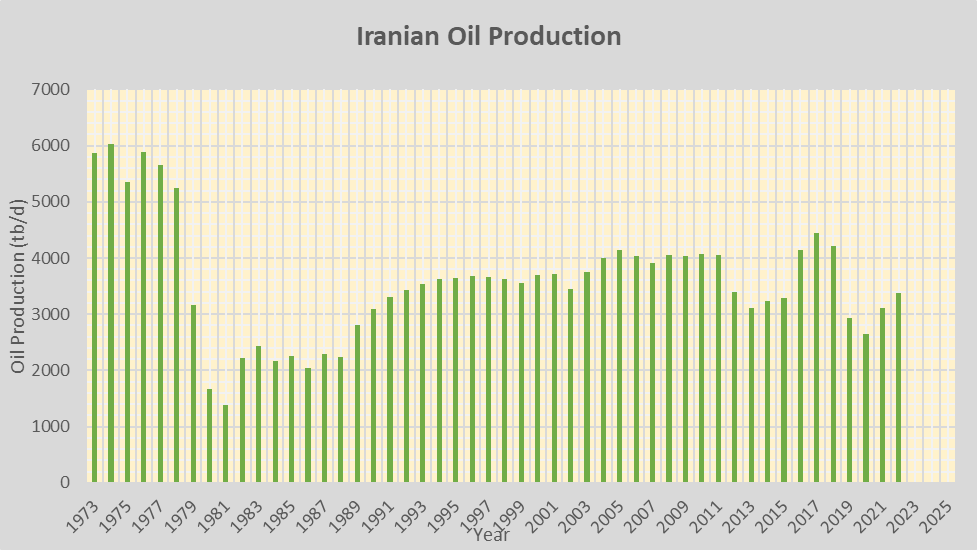
Figure 8-Iranian oil production
Note the high rate of production prior to 1979 when the Shah of Iran was in power. Iran’s oil production reached its highest rate in 1974 at 6.022 mb/d. When the Shah of Iran fell, so did Iran’s oil production.
The Iran-Iraq War, starting in 1980, led to a reduced oil production rate through the 1980s. The reduced production rate during 2012-2015 was due to international sanctions on Iran during that period. The reduced production for the period 2019-2021 was due to sanctions, the pandemic and reduced global demand for oil.
In recent years, the high water make for Iran’s oil production rate was in 2017 at 4.453 mb/d. In the first quarter of 2022, the production rate was 3.377 mb/d.
Iran has 4 fields with EUR values over 10 Gb, shown in Table VII:

Table VII
The sum of reported oil production rates in Table VII is 2.05 mb/d. If indeed those values are accurate for say 2018 that would represent nearly 50% of Iran’s total oil production for that year. I don’t know how accurate the production rates are in Table VII but I suspect it’s valid that those fields still produce a relatively high percentage of Iran’s oil. Iran has numerous other fields in the 0.5-10 Gb range as well.
Iraq-Figure 9 is a graph of Iraqi oil production from 1973 through the first quarter of 2022:
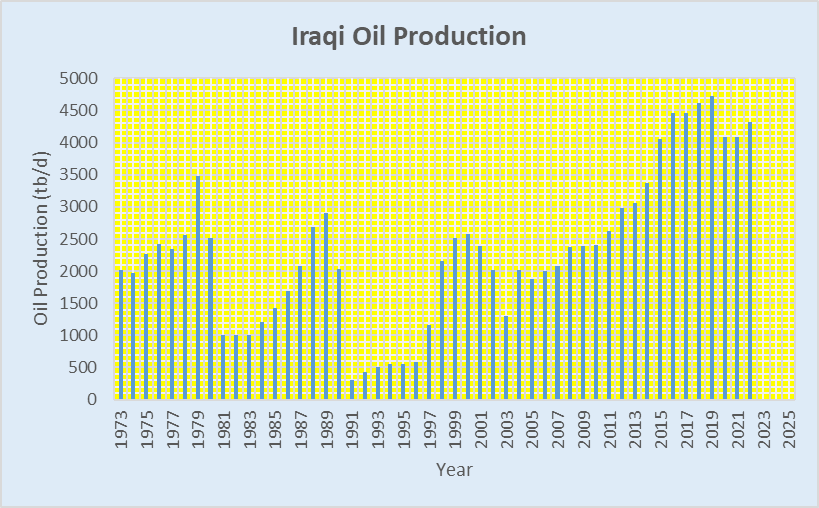
Figure 9-Iraqi oil production
Iraq has been troubled by various political and war related problems that have negatively affected oil production over the years. There was the Iran/Iraq war in the 1980s, the Persian Gulf War in the early 1990s and the Iraq War starting in 2003.The high water mark for Iraqi oil production was in 2018 at 4.623 mb/d. In the first quarter of 2022, the Iraqi oil production rate was 4.323 mb/d.
Iraq has 7 fields with EUR values of at least 4 Gb, shown in Table VIII:
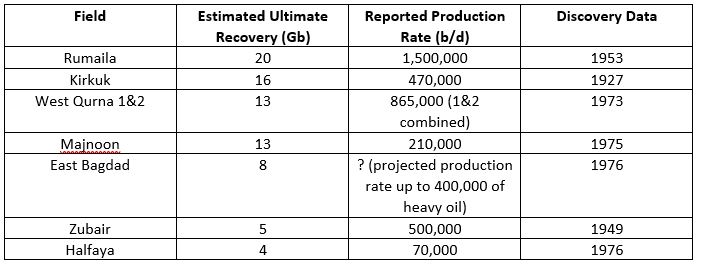
Table VIII
If the reported production rates in Table VIII are accurate, total production from those fields is 3.55 mb/d. In 2019, Iraq’s production rate was 4.72 mb/d. That would mean the fields in Table VIII produced roughly 75% of Iraq’s total oil production in 2019.
The East Bagdad field is projected to start producing 40,000 b/d in 2023 with an ultimate production rate of as high as 400,000 b/d.
United Arab Emirates-Figure 10 is a graph of oil production for the United Arab Emirates for the period 1973 through the first quarter of 2022:
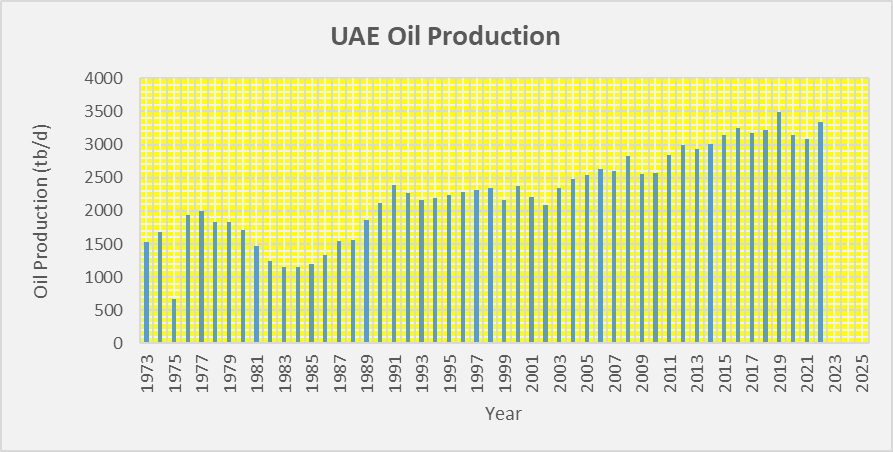
Figure 10-Oil Production for the United Arab Emirates
The highest production rate for the UAE occurred in 2019 at 3.487 mb/d. In the first quarter of 2022, the production rate was 3.339 mb/d.
The UAE has 3 fields with EUR values above 3 Gb, shown in Table IX:

Table IX
The summed oil production for the Table IX fields is 1.92 mb/d. The production rate for the UAE was 3.49 mb/d in 2019, which means that the three Table IX fields produced roughly 55% of UAE’s oil in 2019.
For Middle East OPEC as a whole, cumulative production at the end of 2021 was 385 Gb and the summed EUR for the countries is 739 Gb, according to Colin Campbell’s EUR values. That means that 52.1% of the EUR had been produced by the end of 2021 and 2022 production will be approximately 8.8 Gb.
I don’t expect oil production from the Middle East OPEC countries to significantly exceed the production rates of 2018/2019 in the future irrespective of what the U.S. wants them to produce. But what about other regions of the globe like the Americas?
Teaser photo credit: Headquarters of Kuwait Petroleum Corporation (KPC) in Kuwait City By radiant guy, CC BY-SA 2.0, https://commons.wikimedia.org/w/index.php?curid=5709073


