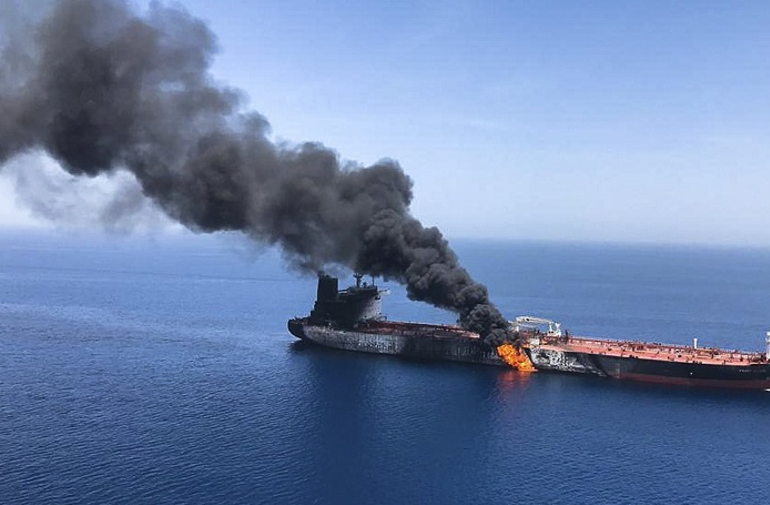
Tankers holed and burning in the Gulf of Oman are not a good sign for future oil exports from the Persian Gulf.

Fig 1: Norway’s Front Altair burning with 75,000 tons of naphtha on board en route from Ruwais (UAE) to Kaohsiung (Taiwan)
 Fig 2: Movements of Front Altair and Kokuka Courageous on 13 Jun 2019
Oil exports from the Persian Gulf have been peaking in the last 3 years 2016-2018 at around 22.3 mb/d. That was before the US sanctions on Iran were tightened in the 1st half of 2019.

Fig 3: Persian Gulf oil exports 1965-2018
Exports are defined here as the difference between oil production (crude oil, condensate and NGLs) and oil consumption with latest data taken from the BP Statistical Review published 11/6/2019.
Let’s go through this country by country with a focus on the period since 2005 when global (conventional) crude oil production started to peak.
 Fig 4: Saudi net oil exports
The drop in Saudi exports after 2005 happened in 2 phases: first, production decline until mid 2007 – which contributed to the oil price shock in 2008 and then secondly lower demand during the 2009 financial crisis. The warnings in Matt Simmons’ book “The coming Saudi oil shock and the world economy” has materialized to some extent without this being recognised by governments, the private sector, the media and the public at large.
30/10/2018 Saudi Update October 2018
5/7/2018 Saudi Arabia was supposed to pump almost 14 mb/d in 2018
 Fig 5: Iraq net oil exports
Sanctions imposed on Iraq after Desert Storm were replaced by an oil for food program started in 1995. It limited Iraq’s oil exports to around 2 mb/d. The objective of the 2003 Iraq war was remove this cap. It was only in 2011 that this export level was exceeded.

Fig 6: Iran net oil exports
Iran’s oil production (and therefore oil exports) peaked in the mid 1970s which caused the 2nd oil crisis in 1979. Oil exports remained on a bumpy plateau after 1990 but dropped sharply when sanctions were tightened to stop Iran developing its nuclear program. As a result, average oil exports since 2005 were 150 kb/d lower than in 2005. The 2015 nuclear deal allowed exports to resume at previous levels and even higher, but not for long.
 Fig 7: Kuwait net oil exports
Kuwait seems to be on an oil export plateau of around 2.6 mb/d, 300 kb/d higher than in 2005.
 Fig 8: United Arab Emirates net oil exports
UAE has increased exports steadily up to around 3 mb/d, a level not exceeded since 2015.
 Fig 9: Qatar net oil exports
Contributions to the 2016-2018 export peak:

Fig 10: Persian Gulf incremental net oil exports 2005-2018
In the above graph, all net oil export drops (mainly from Saudi Arabia) have been summarized in the red line, then all net oil export increases have been added as colored areas. We see the dominance of Iraq, contributing 2.5 mb/d (63%) of around 4 mb/d. Iran’s contribution towards the peak was very modest at 270 kb/d (7%).
While writing this article a US drone was shot down by Iran over the Strait of Hormuz.
 Fig 11: Centcom’s map on location of the drone
Conclusion: Given the tensions there is little chance that Persian Gulf oil exports can increase.


