Recent weeks have seen a number of estimates of how the coronavirus pandemic has affected CO2 emissions in China, the UK, Europe and the world as a whole in 2020.
But a key question for climate change is what impact this has had on the overall amount of CO2 in the atmosphere – the principal driver of global temperature rise. In our analysis for Carbon Brief, we assess whether the global drop in emissions will have a noticeable impact on atmospheric CO2 concentrations this year.
Our findings show that the annual average CO2 concentrations will still increase through this year, even though emissions are reducing. Across the whole year, we estimate CO2 levels will rise by 2.48 parts per million (ppm). This increase is 0.32ppm smaller than if there had been no lockdown – equivalent to 11% of the expected rise.
This means that, although global emissions are smaller, they are still continuing – just at a slower rate. Additional CO2 is still accumulating in the atmosphere.
An analogy is filling a bath from a tap. If the tap represents CO2 emissions, and the water level in the bath is CO2 concentrations, while we have slightly turned the tap down temporarily, water is still flowing into the bath and so the level is still rising. To slow climate change, the tap needs to be turned right down – and permanently.
Forecasting concentrations
The Met Office routinely forecasts how concentrations of CO2 in the atmosphere will change over the coming year. This is based on human emissions from fossil fuel burning, land use and cement production along with the predicted changes in natural carbon sinks and sources due to recent and predicted climatic conditions.
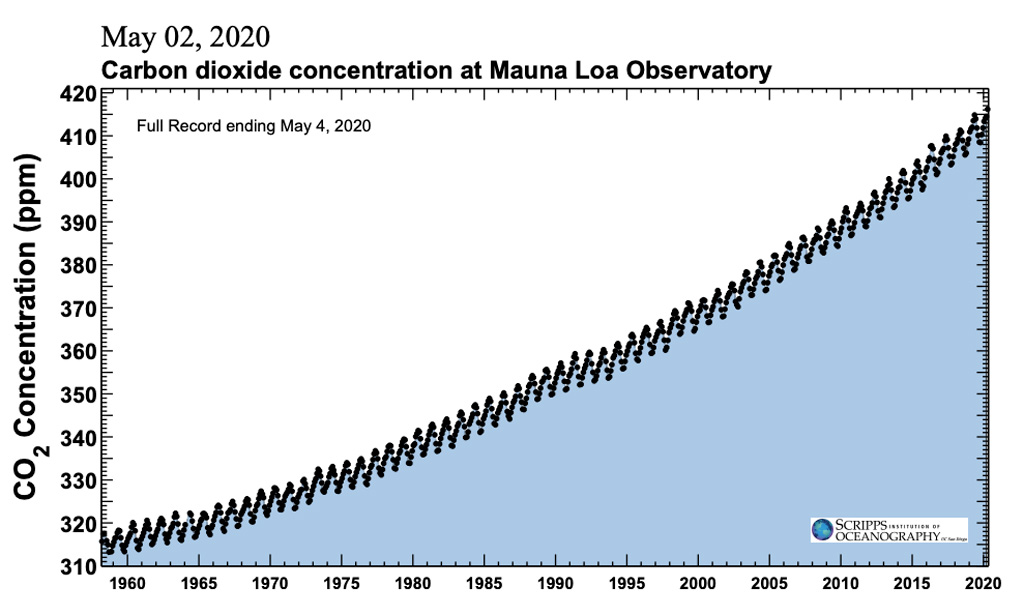
The predictions are made for CO2 at the Mauna Loa observatory in Hawaii, where monitoring has been carried out since 1958. CO2 has steadily risen every year on record – from an annual average of 316ppm in 1959 to 411ppm in 2019 – at an accelerating rate as human-caused emissions have grown. This CO2 record is the data behind the iconic “Keeling Curve”.

Monthly mean CO2 concentrations measured at Mauna Loa Observatory, Hawaii, from 1958 through to 4 May 2020. Credit: Image courtesy of the Scripps Institution of Oceanography
Although human emissions drive the long-term build-up of CO2, the speed of the build-up varies from year to year mainly due to the climate-induced variations, which affect how much CO2 is taken up by land vegetation and the oceans.
For example, the largest annual CO2 rise on record was 3.39ppm between 2015 and 2016, due to the large El Niño event causing drying and warming of the tropics. This caused tropical ecosystems to take up less carbon than in a normal year. While natural land and ocean carbon sinks typically absorb around 50% of fossil-fuel CO2, in 2015-16 it was only about 30%.
Following smaller CO2 increases in subsequent years, we would have expected 2020 to see another relatively large annual CO2 due to climatic impacts on tropical ecosystems. Using last year’s emissions, we would expect this to be 2.80ppm (± 0.57).
The small year-to-year fluctuations in human emissions do not normally cause much change in the speed of CO2 build-up in the atmosphere – in comparison with the variations in natural sinks. Nevertheless, with unusually large changes in emissions predicted this year, an obvious question is: if CO2 is building up more slowly, how noticeable is this? Does it change our predictions of CO2 concentrations for the coming months?
Revised forecast
We can calculate the impact on the Met Office CO2 forecast by adjusting the predicted CO2 concentrations with estimates of the reduction in emissions each month.
Emissions in China decreased by 25% in February, and then increased again. Estimates of changes elsewhere in the world have also been made for the rest of the year, but with high uncertainty. The International Energy Agency (IEA) projects an estimated total global reduction in fossil fuel emissions of almost 2.6bn tonnes of CO2 (GtCO2) over 2020, an 8% reduction, dominated by decreased oil and coal consumption which is expected to peak in the second quarter of the year.
(At this stage it is impossible to really know what the reduction will be, but this provides a scenario which can be used to illustrate the size of the potential effects.)
Using the IEA’s month-by-month projections of the reduced demand for oil and assuming the same profile for natural gas and coal – with an adjustment to account for the sharp reduction in coal use in China in February – we can estimate the potential size of the effect on monthly CO2 concentrations for the rest of this year.
This would reduce the annual increase in concentrations by 0.32ppm, putting it at 2.48ppm (±0.57). This equates to an annual increase that is around 11% smaller than expected without the Covid-19 economic impact.
In other words, without the lockdown, the total amount of CO2 in the atmosphere would have increased by 0.68% in 2020, compared to the 2019 global average. But with the lockdown, we project the increase to be 0.60%.
(It is important to note that Mauna Loa is a single location, and this calculation is for the annual average change in 2020 compared to 2019. So, this does not necessarily represent the long-term global response to the projected reduction in emissions.)
Seasonal cycle of CO2
The measurements at Mauna Loa over recent weeks show that CO2 has continued to rise. The average for April has already set a new record high monthly value of 416.2 ppm, which is likely to be the highest concentration for at least two million years.
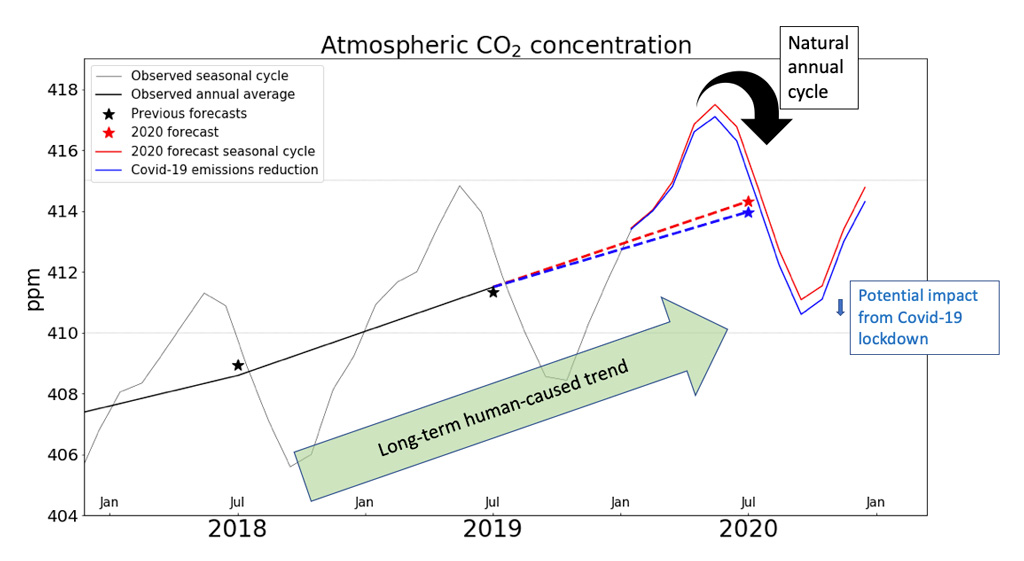
Monthly CO2 at Mauna Loa will reach its annual maximum of 417.1ppm (±0.6) in May, and then decline for the next four months as northern land ecosystems green up and draw CO2 out of the atmosphere. Following an annual minimum in September, CO2 concentrations at Mauna Loa will again rise as northern hemisphere ecosystems release carbon back to the atmosphere in autumn and winter.
The new prediction for the average CO2 in May is 0.4ppm lower than would be expected without the Covid-19 emissions reductions. If global emissions reduce by 8% over the year, with the largest reduction in April, the annual minimum monthly CO2 by September will be 410.6ppm (±0.6), compared to 411.1ppm (±0.6) expected without the Covid-19 impact.
This is highlighted in the chart below, which shows monthly and annual atmospheric CO2 concentrations at Mauna Loa since the start of 2018. The chart illustrates the seasonal cycle of CO2 (thin black line), as well as the initial (red) and revised (blue) forecasts for 2020.

Observed and forecast CO2 concentrations at Mauna Loa, showing both annual and monthly values, illustrating the impact of a potential 8% reduction in global CO2 emissions on the predicted rise in concentrations. Credit: Met Office
It is important to be clear that the declining CO2 concentrations after May will not be a result of reduced emissions due to Covid-19 economic impacts – this will simply be the normal seasonal cycle of the biosphere in operation.
CO2 will rise again as usual after September, but it will not quite reach the heights it would have done without Covid-19. With the scenario assumed here, CO2 concentrations by December would be approximately 0.4ppm lower than they would have been without the Covid-19 impact.
The difference between emissions and concentrations
Although the scenario outlined above slows the rise in CO2 enough to eliminate the slightly faster-than-usual rise originally predicted, we would not expect this to have a detectable impact on the climate. Instead, natural year-to-year swings in climate would swamp any effect.
In other words, while CO2 build-up will be slightly slower than previously expected, it will not be enough to substantially slow global warming.
Reduced emissions of other gases and particles may, however, have other effects – for example, by decreasing the pollution from aerosol particles. The potential effect of these on climate is currently being researched, but may induce a temporary small warming. It may also affect the strength of natural carbon sinks, but this is not accounted for in our calculations here.
The minimal impact of the emissions reductions on the CO2 forecast illustrates the critical point that CO2 emissions and CO2 concentrations are not the same thing. Emissions are the amount of CO2 being released to the atmosphere by human activity, including fossil fuel burning and deforestation. Concentrations are the amount actually in the atmosphere.
Reducing emissions slightly does not immediately reduce concentrations, it only slows the rate of increase. For CO2 to stop building up in the atmosphere, human-caused emissions would need to drop by around 50% in the short term (natural sinks already currently offset around 50% of emissions). The emissions cuts would need to be even larger in the long term, as the sinks will weaken if CO2 starts to stabilise.
Methods
The global carbon cycle and the role of human emissions
Changes in the amount of CO2 in the atmosphere depend on two main factors:
(1) the natural exchanges of CO2 between the atmosphere and the land and oceans.
(2) the additional input of CO2 to the atmosphere (and hence to the system as a whole) by burning fossil fuels which have laid buried deep beneath the ground or ocean floor for millions of years.
The natural exchanges of CO2 between the atmosphere, land and oceans involve a balance between carbon sinks (uptake from the atmosphere) and sources (release to the atmosphere). This balance changes throughout the year and also from year to year and, potentially, over decades.
Overall, the land and oceans are a net sink of carbon, offsetting some of the impact of human emissions and keeping the build-up of CO2 concentrations in the atmosphere at about half the rate of human-caused emissions (the “airborne fraction”). However, the strength of this net sink varies with weather and climate conditions, so changes over time with the seasons, year-to-year climate variability, and long-term climate change. The atmosphere-land exchanges are also altered directly by human land use, and the impact of this can also be affected by weather conditions – for example, fires can be ignited by people, but burn more severely in hot, dry weather.
Forecasting the annual CO2 rise
The Met Office forecasts of the annual CO2 rise depend mainly on the year-by-year changes in natural carbon sinks and have proven successful. The record large rise between 2015 and 2016 was successfully predicted, on the basis of a prior forecast of the strength of the El Niño event and the related drying and warming of tropical land ecosystems which weakened them as a carbon sink. It was also successfully predicted that September 2016 would be the first time that the annual minimum concentration remained above 400ppm. Smaller annual CO2 rises were successfully predicted in 2017 and 2018, linked to La Niña conditions which had the opposite effect. The rise in 2019 was successfully predicted to be slightly faster, but not as fast as 2016, due to moderate El Niño-like conditions in the Pacific. These conditions were also successfully predicted to persist into early 2020, leading to the original prediction of another relatively fast CO2 rise this year.
Although in reality the details of the CO2 seasonal cycle vary from year to year, the current method for the CO2 forecast does not account for this, and simply assumes the same shape each year. Monthly CO2 concentrations are calculated by subtracting or adding a certain amount relative to the predicted annual mean concentration, based on the average difference for each calendar month over previous years.
An updated forecast prior to Covid-19
The forecast issued in January 2020 was for an annual rise of 2.74ppm (±0.57) between 2019 and 2020, using an initial estimate of CO2 emissions in 2019 and a forecast of the sea surface temperatures (SSTs) in the equatorial Pacific for the next three months. With updated information on 2019 emissions and the observed SSTs now being available, the forecast prior to Covid-19 impacts can be updated. The IEA reported no change in fossil fuel emissions between 2018 and 2019, so since our statistical relationship is calibrated against the Global Carbon Project (GCP) emissions estimates, we use the GCP 2018 fossil fuel emissions estimate of 9.98 GtC for 2019. We also use the GCP 2019 land use emissions estimate of 1.7 GtC, giving a total of 11.68 GtC for 2019. The overall result (without Covid-19 impacts) is a slightly larger forecast annual CO2 rise of 2.80ppm (±0.57), mainly due to the SSTs being slightly warmer than forecast (an anomaly of 0.667C rather than 0.592C).
Updating the forecast for Covid-19 impacts
We examine the IEA scenario of a reduction in annual CO2 emissions from fossil fuels of almost 2.6 GtCO2 (an 8% reduction from 2019), consisting of reductions of 1.1, 1.0 and 0.4 GtCO2 from coal, oil and gas respectively. (These do not sum to 2.6 due to rounding to one decimal place.) We use the IEA’s month-by-month profile of reductions in global oil demand and assume the same profile applies to global emissions from coal and gas, with an adjustment to coal in February to account for the large emissions reductions in China, which were largely associated with coal. We assume the emissions reductions are shared between China, the USA, the EU28 and the rest of the world in proportion to their relative contribution to global fossil fuel emissions in 2019, except for January when a small reduction in US oil was reported by the IEA, and February when the reduction in China was 0.2 GtCO2.
| Global | China | USA | EU28 | Rest of World | |
|---|---|---|---|---|---|
| Jan | -0.02 | 0 | -0.02 | 0 | 0 |
| Feb | -0.23 | -0.2 | 0 | 0 | -0.04 |
| Mar | -0.25 | -0.07 | -0.04 | -0.02 | -0.12 |
| Apr | -0.65 | -0.18 | -0.09 | -0.06 | -0.31 |
| May | -0.58 | -0.16 | -0.08 | -0.05 | -0.28 |
| Jun | -0.33 | -0.09 | -0.05 | -0.03 | -0.16 |
| Jul | -0.14 | -0.04 | -0.02 | -0.01 | -0.07 |
| Aug | -0.09 | -0.03 | -0.01 | -0.01 | -0.04 |
| Sep | -0.07 | -0.02 | -0.01 | -0.01 | -0.03 |
| Oct | -0.05 | -0.01 | -0.01 | -0.00 | -0.02 |
| Nov | -0.05 | -0.01 | -0.01 | -0.00 | -0.02 |
| Dec | -0.05 | -0.01 | -0.01 | -0.00 | -0.02 |
| Annual | -2.5 | -0.83 | -0.35 | -0.21 | -1.12 |
Scenario of monthly fossil fuel emissions reductions in GtCO2, based on IEA projections and other information from the Global Carbon Project and Carbon Brief
It should be noted that total CO2 emissions also include emissions from land use change and cement production. No information is available for changes in these, so our calculations only consider the change in emissions from fossil fuel burning.
We use the atmospheric tracer model TM3 to calculate the impact of the month-by-month emissions reductions on the CO2 concentrations at Mauna Loa. This model simulates how the wind carries CO2 away from the sources of emissions and through the atmosphere around the globe. We simulated the CO2 concentrations both with normal emissions and with the above emissions reductions in the relevant locations, using wind patterns from the NCEP reanalysis (an atmosphere model combined with observations). The difference in CO2 concentrations between the two simulations at Mauna Loa gave the impact of the emissions reductions on concentrations at that location.
We repeated this for five years of simulation (2013 to 2018) and took the average as representative of the circulation patterns affecting Mauna Loa this year – in other words, we assumed the mean climatology of atmospheric circulation. The precise concentrations at Mauna Loa will depend on the specific wind directions.
We then applied these month-by-month concentration reductions to the above forecast of monthly CO2 at Mauna Loa, to obtain a revised forecast accounting for the projected emissions reductions.
| Original 2020 forecast | Revised 2020 forecast without Covid-19 economic impacts | Revised 2020 forecast assuming an 8% reduction in fossil fuel (FF) emissions following Covid-19 | |
|---|---|---|---|
| 2019 total emissions (GtC) | 11.56 | 11.68 | 11.68 |
| 2020 FF emissions reduction (GtCO2) | – | – | 2.6 |
| 2020 FF emissions reduction (GtC) | – | – | 0.71 |
| Nino3.4 SST anomaly (C) | 0.592 | 0.667 | 0.667 |
| Annual CO2 rise (ppm) | 2.74 | 2.80 | 2.48 |
| Annual CO2 concentration (ppm) | 414.2 | 414.3 | 414.0 |
| Monthly CO2 concentrations (ppm) | |||
| January | 413.4 | 413.4 | 413.4 |
| February | 414.0 | 414.0 | 414.0 |
| March | 414.9 | 414.9 | 414.8 |
| April | 416.8 | 416.8 | 416.6 |
| May | 417.4 | 417.5 | 417.1 |
| June | 416.7 | 416.7 | 416.3 |
| July | 414.7 | 414.8 | 414.3 |
| August | 412.6 | 412.7 | 412.2 |
| September | 411.0 | 411.1 | 411.6 |
| October | 411.5 | 411.5 | 411.1 |
| November | 413.3 | 413.4 | 413.0 |
| December | 414.7 | 414.7 | 414.3 |
Comparison of the original 2020 Mauna Loa CO2 forecast issued in January, a revised forecast with updated information on sea surface temperatures and using 2019 emissions, and the further revision accounting for projected emissions reductions in 2020.
Acknowledgements
We thank Dr Simon Evans, Carbon Brief’s policy editor, for advice on the use of the IEA emissions reduction projections.


Comments